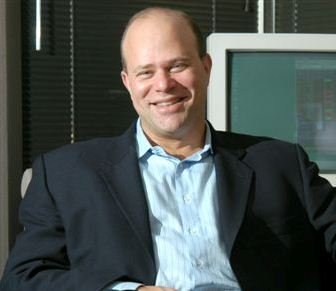
David Tepper
David Tepper's APPALOOSA LP holds 31 U.S.-equity positions worth $5.9B (SEC 13F, Q1 2026). Top positions: Amazon.Com Inc 15.2%, Micron Technology, Inc. 9.5%, Alphabet Inc. Class C Capital Stock 8.4%. 13F-replication return is +113% over 3 years (+34 pts vs the S&P 500) — a replicated, non-audited figure.
Holdings
| Stock | % of portfolio | Shares | Value | Latest activity | Avg buy price | Current price | Date |
|---|---|---|---|---|---|---|---|
| AMZN Amazon.Com Inc | 15.2% | 4.3M | $900M | ▲ 98% (+2.1M) | $165.98 | $249.66 (+50%) | 2026-03-31 |
| MU Micron Technology, Inc. | 9.5% | 1.7M | $563M | ▼ 4.9% (−85K) | $231.11 | $1,062.39 (+360%) | 2026-03-31 |
| GOOG Alphabet Inc. Class C Capital Stock | 8.4% | 1.7M | $497M | ▼ 3.0% (−54K) | $157.62 | $341.94 (+117%) | 2026-03-31 |
| UBER Uber Technologies, Inc. | 7.7% | 6.3M | $456M | ▲ 242% (+4.5M) | $67.53 | $68.34 (+1%) | 2026-03-31 |
| TSM Taiwan Semiconductor Manufac | 7.6% | 1.3M | $449M | ▲ 17% (+198K) | $223.99 | $456.19 (+104%) | 2026-03-31 |
| BABA Alibaba Group Hldg Ltd | 7.3% | 3.5M | $435M | ▼ 33% (−1.7M) | $77.67 | $108.85 (+40%) | 2026-03-31 |
| VST Vistra Corp. | 5.1% | 2.0M | $304M | ▲ 114% (+1.1M) | $140.26 | $141.01 (+1%) | 2026-03-31 |
| EWY Ishares Inc | 5.0% | 2.4M | $295M | ▲ 28% (+525K) | $102.86 | $184.39 (+79%) | 2026-03-31 |
| NVDA NVIDIA CORP | 4.3% | 1.5M | $257M | ▼ 13% (−228K) | $142.85 | $230.82 (+62%) | 2026-03-31 |
| NRG NRG Energy, Inc. | 4.3% | 1.7M | $253M | ▲ 5.8% (+94K) | $94.24 | $96.86 (+3%) | 2026-03-31 |
| META Meta Platforms, Inc. Class A Common Stock | 4.2% | 436K | $250M | ▼ 27% (−164K) | $436.34 | $732.25 (+68%) | 2026-03-31 |
| SNDK Sandisk Corporation Common Stock | 3.0% | 281K | $179M | NEW (+281K) | $635.34 | $1,755.75 (+176%) | 2026-03-31 |
| GLW Corning Incorporated | 2.6% | 1.1M | $154M | ▼ 28% (−441K) | $47.30 | $152.85 (+223%) | 2026-03-31 |
| WHR Whirlpool Corp. | 1.8% | 1.9M | $105M | ▼ 50% (−2.0M) | $80.04 | $30.25 (−62%) | 2026-03-31 |
| PDD Pdd Holdings Inc | 1.6% | 900K | $92M | ▼ 49% (−875K) | $123.20 | $78.18 (−37%) | 2026-03-31 |
| LRCX Lam Research Corp | 1.4% | 382K | $82M | ▼ 10% (−42K) | $85.04 | $339.09 (+299%) | 2026-03-31 |
| BIDU Baidu Inc | 1.3% | 692K | $77M | ▲ 20% (+117K) | $119.55 | $87.56 (−27%) | 2026-03-31 |
| LHX L3Harris Technologies, Inc. | 1.1% | 198K | $68M | ▼ 33% (−97K) | $215.24 | $236.94 (+10%) | 2026-03-31 |
| RTX RTX Corporation | 1.1% | 342K | $66M | ▼ 32% (−158K) | $146.02 | $185.70 (+27%) | 2026-03-31 |
| ASML Asml Hldg Nv | 1.1% | 50K | $65M | ▼ 21% (−13K) | $720.79 | $1,817.25 (+152%) | 2026-03-31 |
| QCOM Qualcomm Inc | 1.1% | 499K | $64M | ▼ 56% (−646K) | $153.06 | $183.72 (+20%) | 2026-03-31 |
| BALL Ball Corporation | 0.8% | 837K | $49M | ▼ 30% (−363K) | $52.97 | $55.50 (+5%) | 2026-03-31 |
| AMD Advanced Micro Devices | 0.8% | 221K | $45M | ▼ 32% (−104K) | $114.28 | $616.58 (+440%) | 2026-03-31 |
| JD Jd.com Inc | 0.7% | 1.3M | $39M | ▼ 69% (−2.9M) | $34.17 | $26.71 (−22%) | 2026-03-31 |
| LYFT Lyft, Inc. Class A Common Stock | 0.6% | 2.7M | $36M | ▼ 29% (−1.1M) | $13.59 | $15.00 (+10%) | 2026-03-31 |
| MSFT MICROSOFT CORP | 0.6% | 90K | $33M | ▼ 82% (−410K) | $416.26 | $519.35 (+25%) | 2026-03-31 |
| KWEB Kraneshares Trust | 0.5% | 1.1M | $31M | ▼ 77% (−3.7M) | $33.96 | $24.61 (−28%) | 2026-03-31 |
| ET Energy Transfer LP Common Units representing limited partner interests | 0.5% | 1.6M | $30M | ▼ 28% (−615K) | $12.52 | $19.61 (+57%) | 2026-03-31 |
| MPLX MPLX LP | 0.5% | 502K | $29M | ▼ 20% (−125K) | $38.64 | $55.95 (+45%) | 2026-03-31 |
| UNH UNITEDHEALTH GROUP INCORPORATED (Delaware) | 0.4% | 90K | $24M | ▼ 55% (−110K) | $323.60 | $369.91 (+14%) | 2026-03-31 |
| DB Deutsche Bank Aktiengesellschaft | 0.1% | 258K | $8M | ▼ 92% (−2.9M) | $24.17 | $35.24 (+46%) | 2026-03-31 |
FAQ ▾
What are David Tepper's largest holdings?
As of the latest 13F: Amazon.Com Inc 15.2%, Micron Technology, Inc. 9.5%, Alphabet Inc. Class C Capital Stock 8.4%, Uber Technologies, Inc. 7.7%, Taiwan Semiconductor Manufac 7.6%.
How big is APPALOOSA LP's 13F portfolio?
$5.9B across 31 disclosed U.S.-equity positions.
What is David Tepper's 3-year performance?
+113% (13F-replication, price return), +34 pts vs the S&P 500. Not an audited fund return.
Where does this data come from?
U.S. SEC Form 13F-HR institutional holdings filings.
Sourced from SEC Form 13F-HR filings · Not investment advice ▾
Latest activity = change vs. the prior 13F. Avg buy price = est. entry over the trailing 3 years (gain = vs. latest price). Returns are 13F-replication, not audited fund returns. Sourced from SEC 13F filings.